Advanced features of the tool editor
Miscellaneous techniques for using the Tool Editor
This page contains procedures related to the legacy editor. Try out our new editor that has a more streamlined design and provides a better app editing experience. More info.
Annotating output files with metadata
You may want to annotate the files produced by a tool with metadata, which will then be used by other tools in a workflow. See the Platform documentation for more information on how metadata is used. You can choose the the name and type of these metadata by defining your own key-value pairs. Any keys can be used, but see this list for commonly used file metadata.
To enter key-value pairs that will be added to output files as metadata, click on any output port that you have listed on the Outputs tab. There is a field for keys and a field for values.
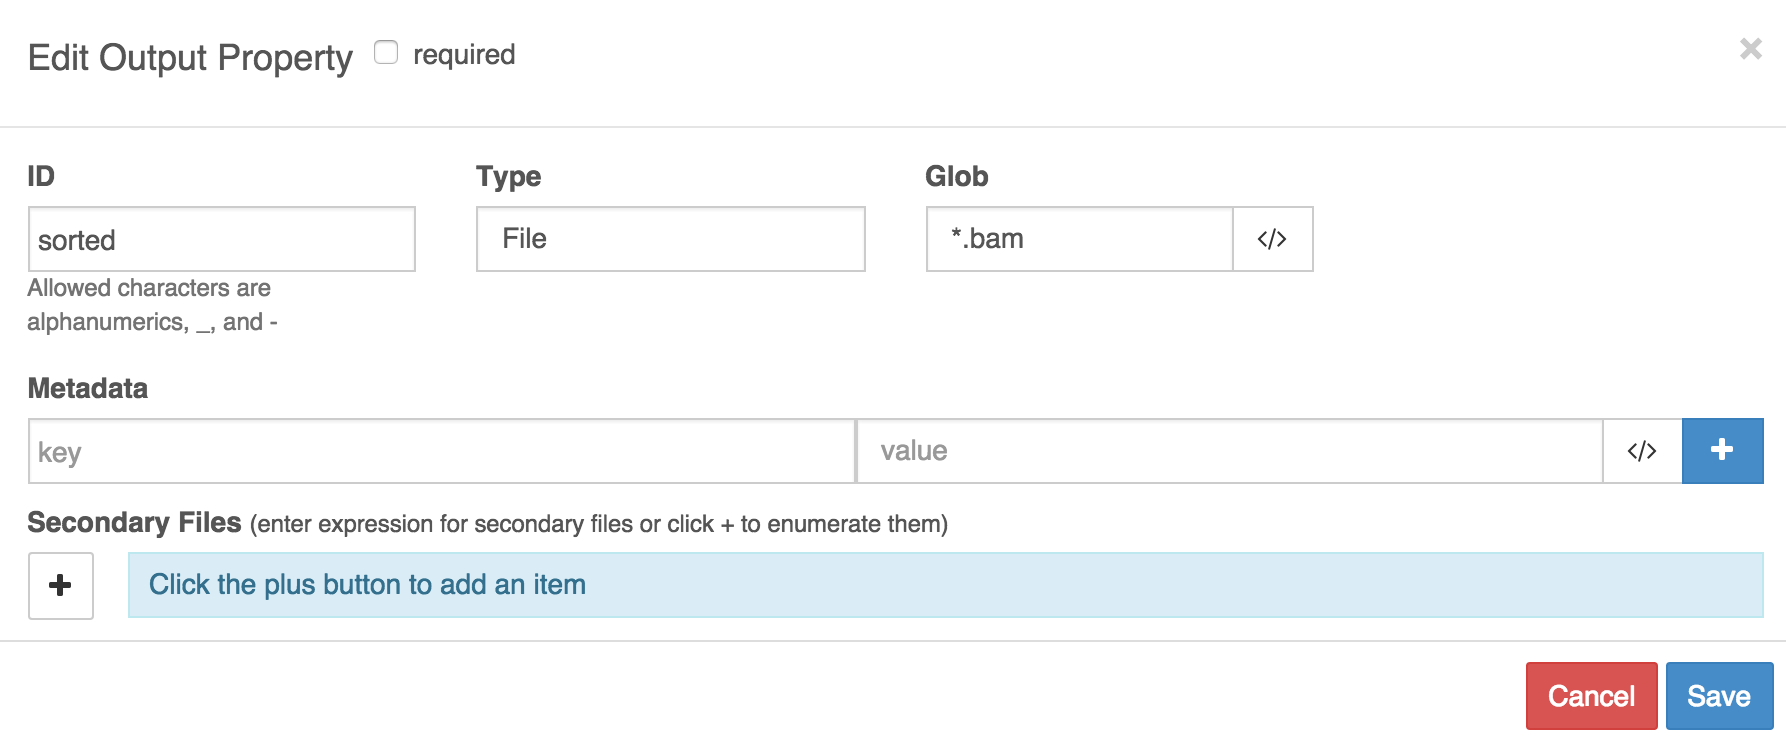
Using dynamic expressions to capture metadata:Metadata values can be string literals or dynamic expressions. For instance, the
$selfobject can be used to refer to the path of the file being outputted. See the documentation on dynamic expressions in tool descriptions for more details.
Custom input structures for tools
Certain tools will require more complex data types as inputs than simply files, strings, and so on. In particular, you may need to input arrays of structures. This requires you to define a custom input structure that is essentially an input type that is composed of further input types. A common situation in which you'll need to use a complex data structure is to when the input to your bioinformatics tool is a genomic sample. This will consist of, say, a BAM file and a sample ID (string), or perhaps two FASTQ files and an insert size (int).
To define a custom input structure:
- On the Inputs tab of the tool editor select the Data Type as array from the drop-down list.
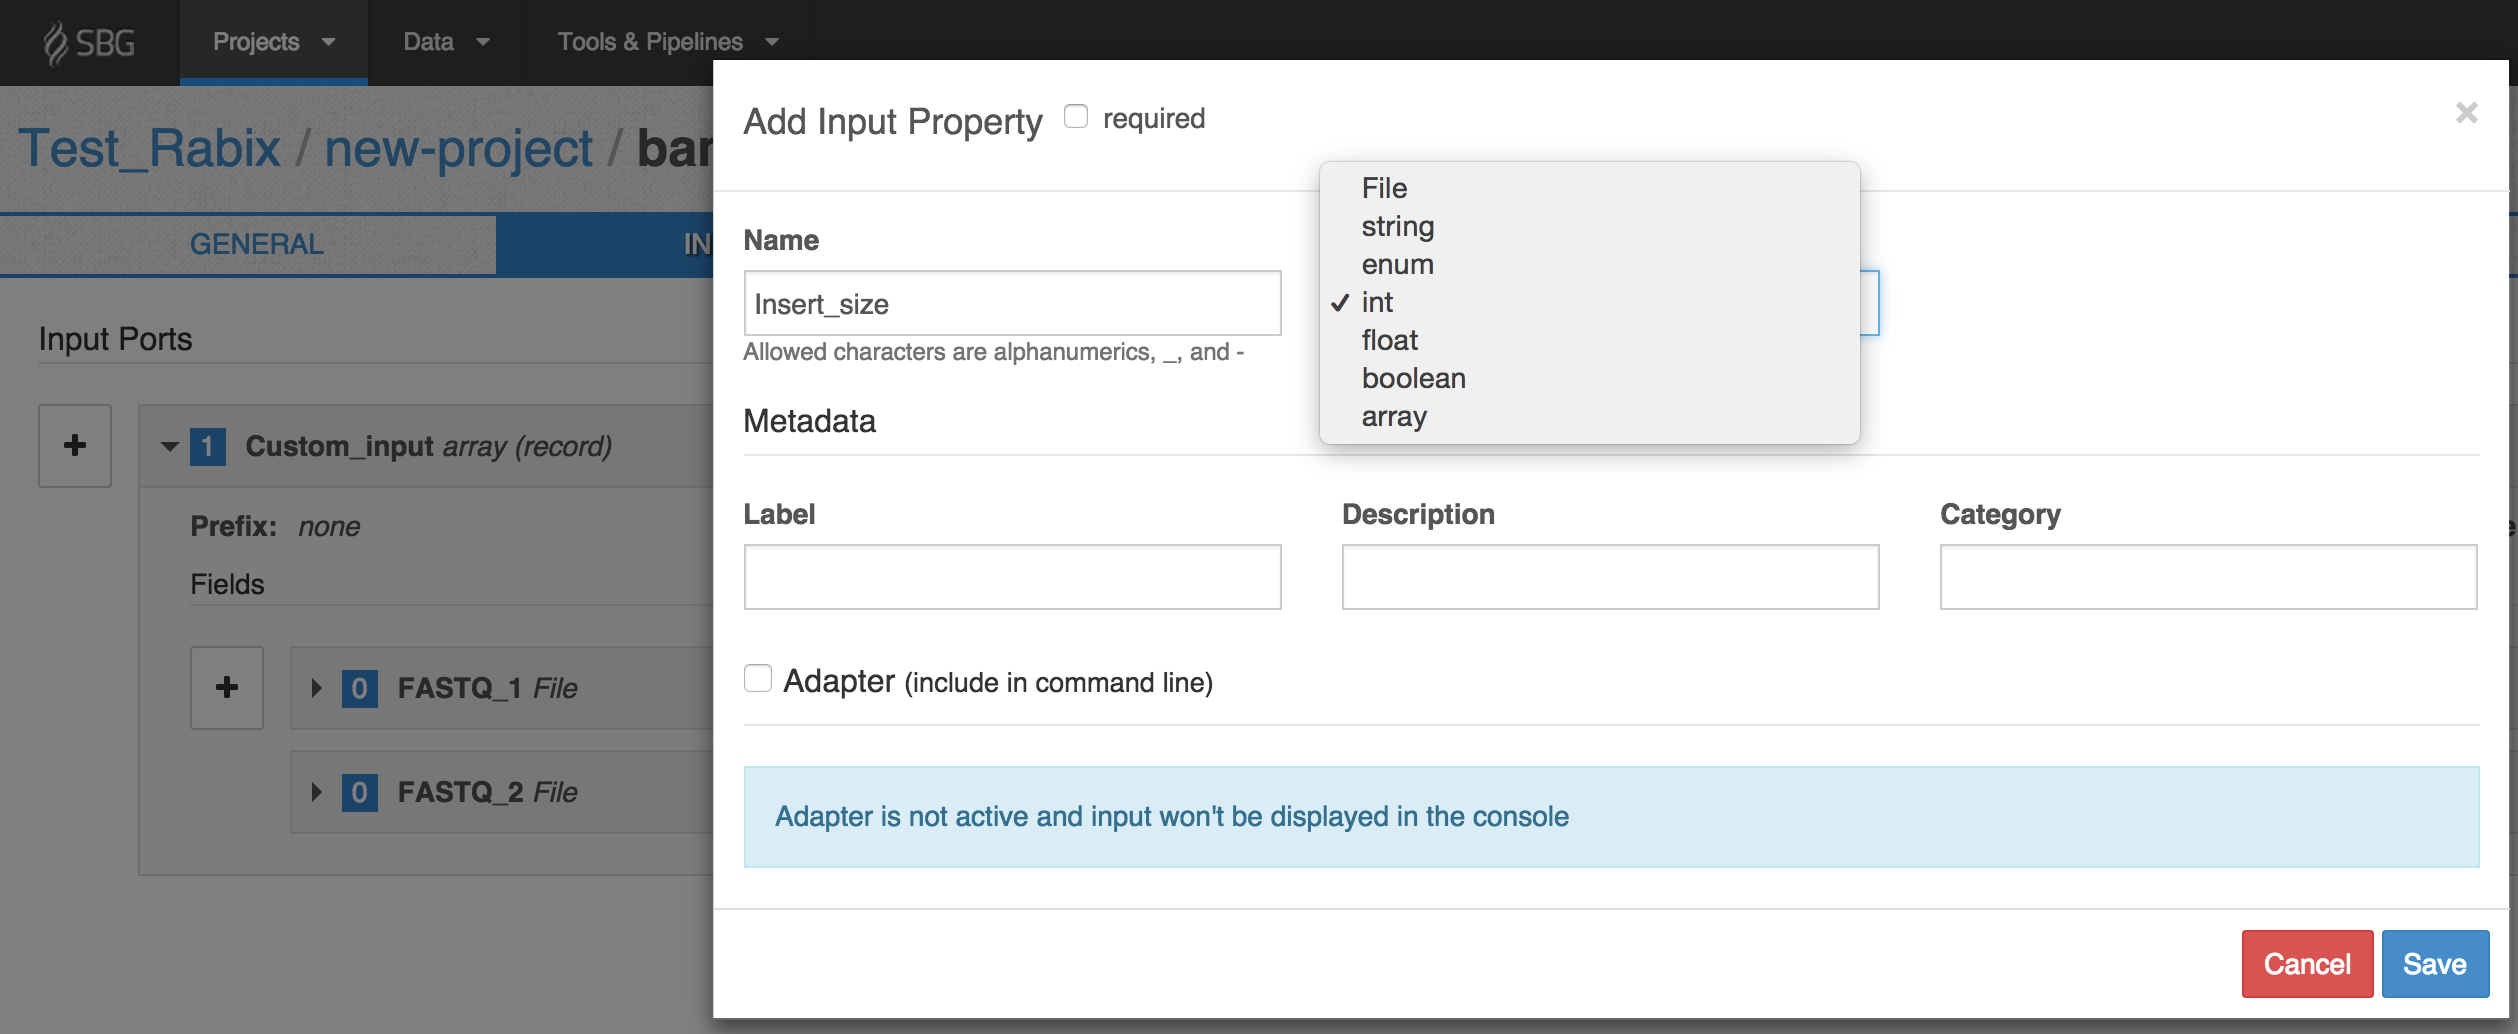
- This will then prompt you for an Item Type; in this field, you should select 'record' to define your own types. In the example shown below we have given the array the ID 'Custom_input'. You can give it any name you choose.

- Once you have created the input array and saved it (closing the window), you can define its inputs. To do this, click on the array in the list of inputs on the Inputs tab. This will bring up a button marked + labeled Click the plus button to define a field.

- The + button lets you define the individual input ports that the array is composed of. You define the input ports of an input array in the same way as you would usually define an input port for a tool. In our example, let's set the array data structure to take three inputs, two of which are FASTQ files, and the third of which is the insert size. We'll label the input ports with the IDs 'FASTQ_1', 'FASTQ_2' and 'Insert_size' respectively. We set the Type of the first two to File, and the Type of the third as int.
Describing index files
Some tools generate index files, such as .bai, .tbx, .bwt files. Typically, you will want the Platform to treat indexes as attached to their associated data file, so that they will be copied and moved along with the data file in workflows. To represent the index file as attached to its data file you should make sure that:
- The index file has the same filename as the data file and is stored in the same directory as it.
- You have indicated in the tool editor that an index file is expected to be output alongside the data file.
To do this:
On the Outputs tab of the editor, enter the details of the data file as the output. Under Secondary Files enter the extension of the index file, modified according to the following convention:
Suppose that the index file has extension '.ext'.
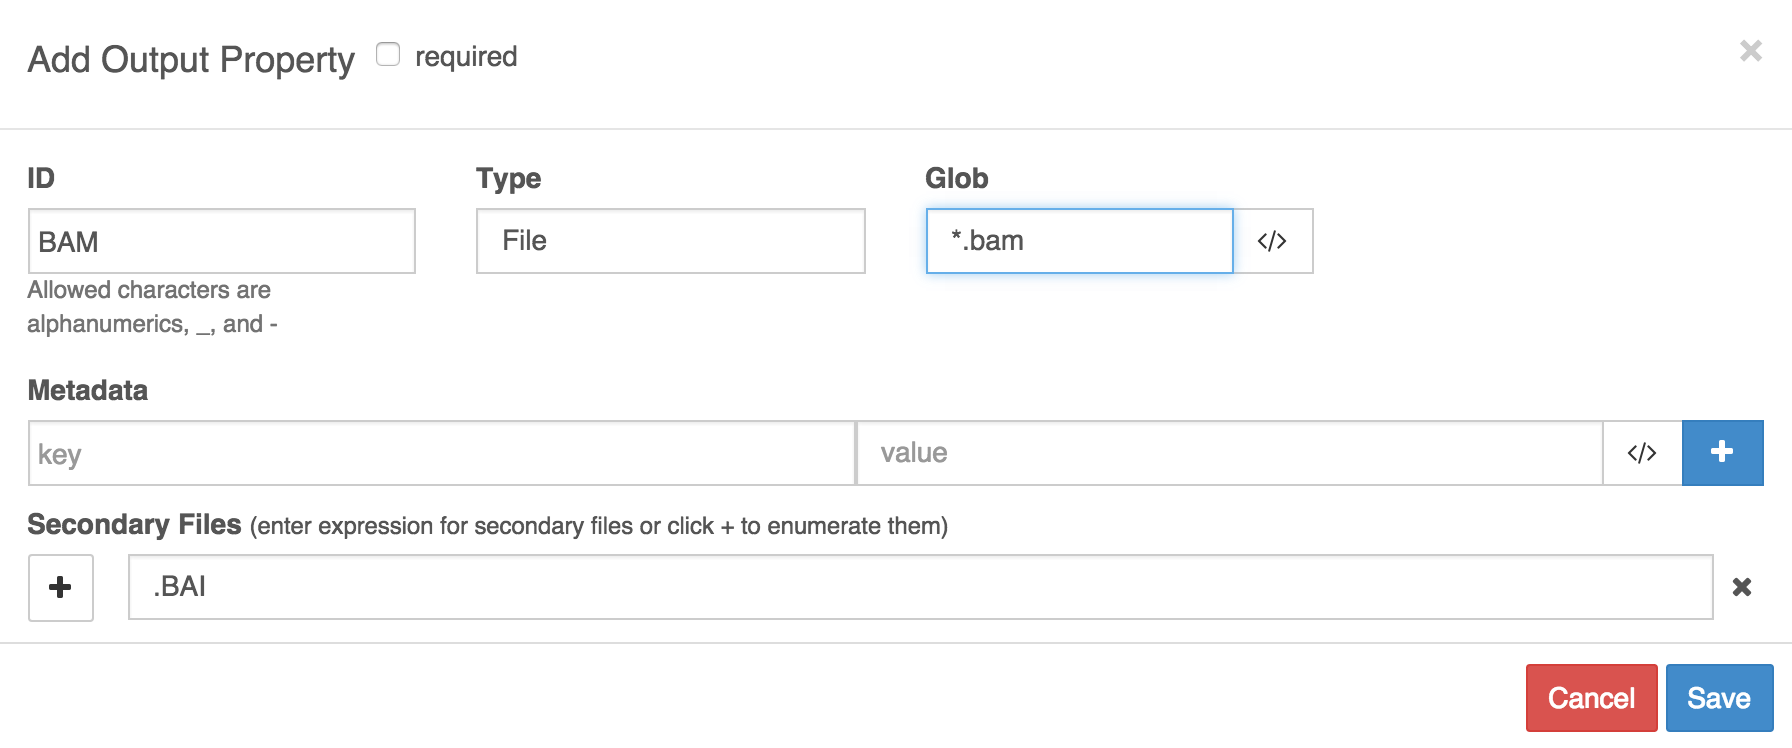
- If the index file is named by simply appending '.ext' onto the end of the extension of the data file, then simply enter .ext in the Secondary Files field. For example, do this if the data file is a .bam and the index extension is .bai (see example A).
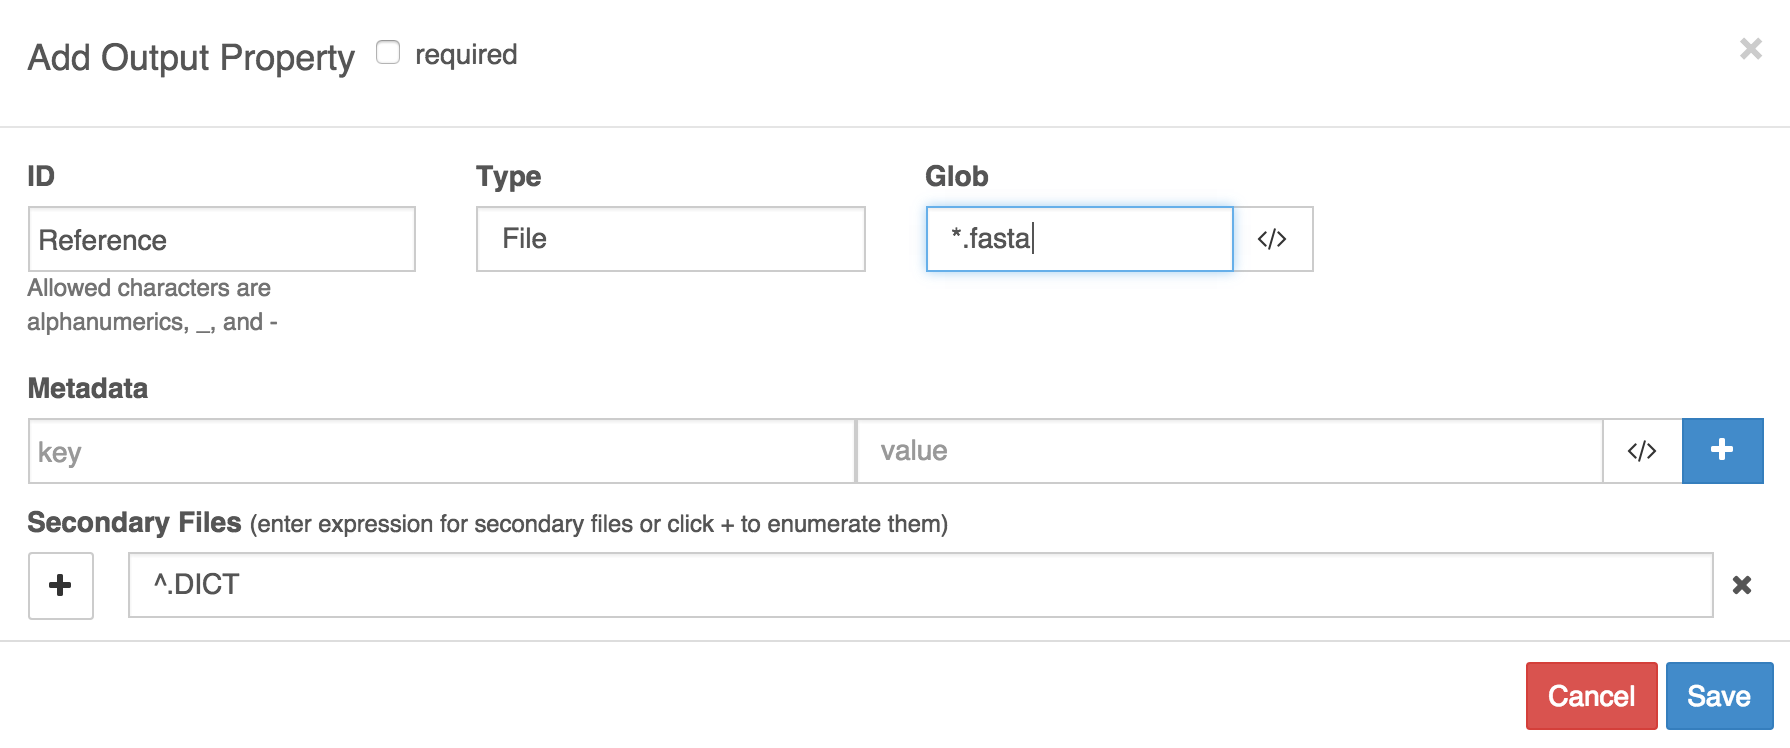
- If the index file is named by replacing the extension of the data file with '.ext', then enter ^.ext in the the Secondary Files field. For example, when the data file is a fasta contig list and the index extension is .dict (see example B).
In example A, we have named the output port 'BAM' and set up globbbing to catch files whose names contain '.bam' to be designated as its outputs. We have also specified that a secondary file is expected, and that it should have the same name as the BAM file, but have extension '.BAI' appended to the file extension of the BAM file.
Example A
In example B, the output port is named 'Reference' and it catches files whose names contain 'fasta'. We have specified that an index file is expected, and that it will have the same file name as the FASTA file but that the extension '.DICT' will replace the extension of the FASTA file.
Example B
Attaching index files and data files
Some tools ('indexers') only output index files for inputted data files; they do not output the data file and the index together. If your tool is one of these, then the index file will be outputted to the current working directory of the job, but the data file will not. This can make it difficult to forward the data file and index file together.
In this case, if you need to forward an input file with an attached index file, then you should copy the data file to the current working directory of the job (tool execution), since this is the directory to which the index file will be outputted. To copy the data file to the current working directory, select copy under Stage Inputs on the description of that input port.

Stage Input
Upload your own CWL tool description
As an alternative to using the Seven Bridges tool editor, you can upload your own description of your tools as JSON or YAML files in accordance with CWL. This method is useful if you already have these files for your tools.
To upload your own tool description:
- Click on the cog icon in the top right of the tool editor.
- Select Import.
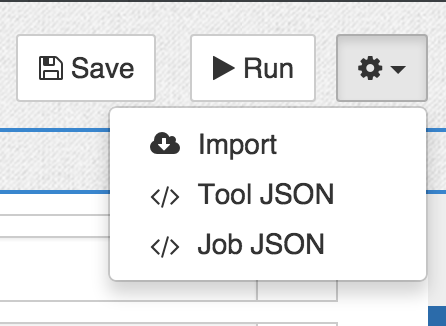
- Copy and paste your CWL description into the pop-out window.
Alternatively, you can use the API to upload CWL files describing your tools or workflows as JSON.
To get started writing CWL by hand, see this guide. Alternatively, try inspecting the CWL descriptions of public apps by opening them in the tool editor, clicking the cog icon in the top right corner, and selecting </> Tool JSON.
Configure the log files for your tool
Logs are produced and kept for each job executed on the Platform. They are shown on the visual interface and via the API:
- To access a job's logs on the visual interface of the Platform, go to the view task logs page.
- To access a job's logs via the API, issue the API request to get task execution details.
You can modify the default behavior so that further files are also presented as the logs for a given tool. This is done using a 'hint' specifying the filename or file extension that a file must match in order to be named as a log:
- Open your tool in the tool editor by clicking the pencil icon next to its name.
- Click the ellipses ( . . .) menu on the right, as shown below:
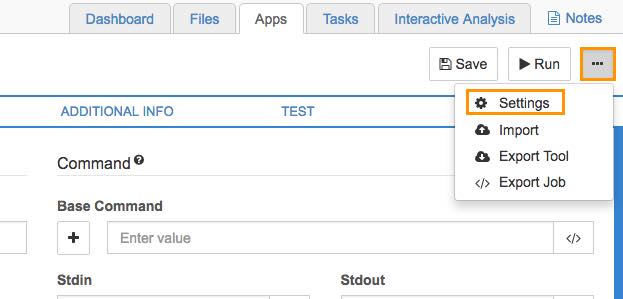
Click the ellipses on the tool editor.
- Choose Settings.
The Hints window for configuring the log file will be displayed, as shown below.
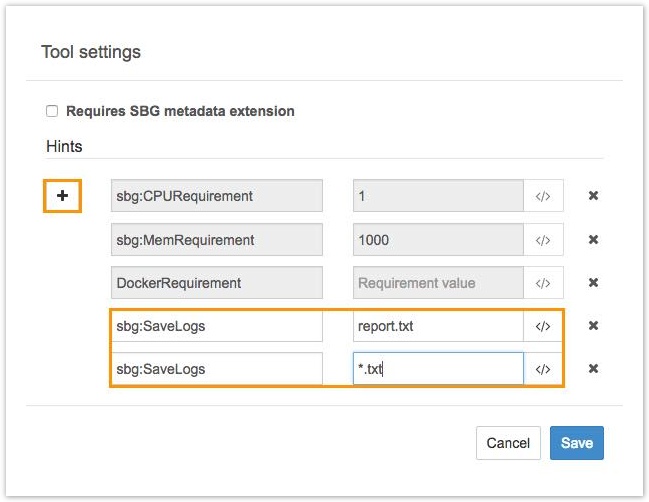
The Hints window.
- Click the plus button (+) to add a new hint, consisting of a key-value pair. To configure the log files for your tool, enter
sbg:SaveLogsfor the key, and a glob (pattern) for the value. Any filenames matching the glob will be reported as log files for jobs run using the tool.
For example, the glob*.txtwill match all files in the working directory of the job whose extension is '.txt'. For more information and examples, see the documentation on globbing. You can also enter a literal filename, such asresults.txtto catch this file specifically. - Click Save to save the changes. You can add values (globs) for as many log files as you like. A glob will only match files from the working directory of the job, without recursively searching through any subdirectories.
Differences between the API and visual interfaceNote that the files shown as logs differ depending on whether you are viewing the logs of a job via the visual interface or via the API.
- By default, the view task logs page on the visual interface shows as logs any *.log files in the working directory of the job (including std.err.log and cmd.log) as well as job.json and cwl.output.json files.
- By default, the API request toget task execution details shows as the log only the standard error for the job, std.err.log.
Consequently, if you set the value of
sbg:SaveLogsto*.logthen this will change the files displayed as logs via the API, but will not alter the files shown as logs on the visual interface, since the visual interface already presented all .log files as logs. However, if you add a new value of*.txtforsbg:SaveLogs, then .txt files will be added to the log files shown via the visual interface and API.
Updated 6 months ago
