Review Enterprise data throughput
Overview
As an Enterprise administrator or Division administrator you are able to review the data throughput either for the whole Enterprise or for individual divisions and for the desired time interval (e.g. week, month or the whole year). Files used in tasks, Data Studio analyses, and automations are included in the data throughput calculation.
Files used in tasks
The following files used in tasks will be included in the data throughput calculation:
- task input files
- secondary input files
- tasks uploaded from a project which is using the SBFS feature.
Only files that are used by the tools inside a task will be included in the data throughput calculation.
For example:
- if several files are set as task input file but only one is used by the tool, that one file will be included in the calculation.
- if you set the folder as task input only files that are actually used by tools will be included.
- if the same file is used by multiple tools inside a task, it will be calculated only once.
Furthermore, files that are downloaded by the task from external sources i.e. other platforms (eg. S3 bucket, FTP server or similar) are also included in the calculation.
Files used in a Data Studio analysis
All files and folders that are downloaded from the project and used in a Studio analysis will be included in the data throughput calculation.
This also applies to files that are downloaded from external sources i.e. other platforms (eg. S3 bucket, FTP server or similar). However, once the files are downloaded, they will no longer be included in the data throughput calculation when used in the Studio workspace even after an analysis has been closed or restarted.
Files used in a task run by an Automation
For all tasks run by one Automation, throughput will be calculated as for any other task on the Platform (see above).
However, if a file is used by several tasks inside one automation, throughput will be calculated only once. In addition, when an output of a task is used as an input for the task that follows, that file will not be included in the calculation.
Procedure
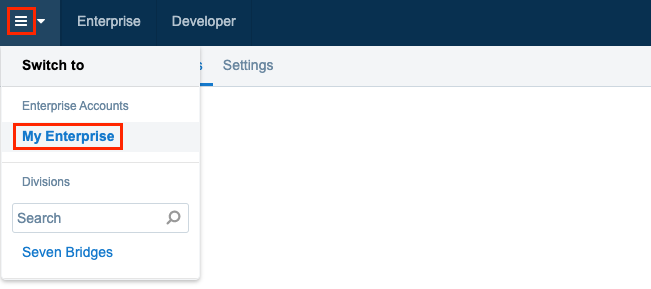
- Open the menu in the upper left corner.
- Click the name of your Enterprise.

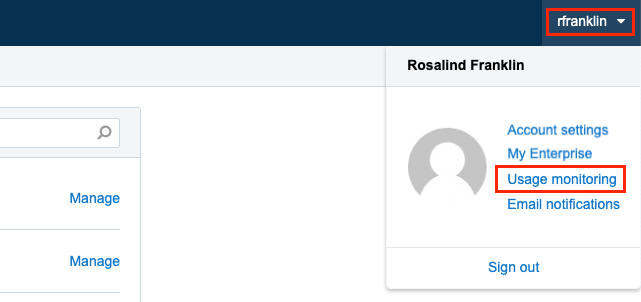
- Next, click on your username in the upper right corner.
- Choose Usage monitoring.

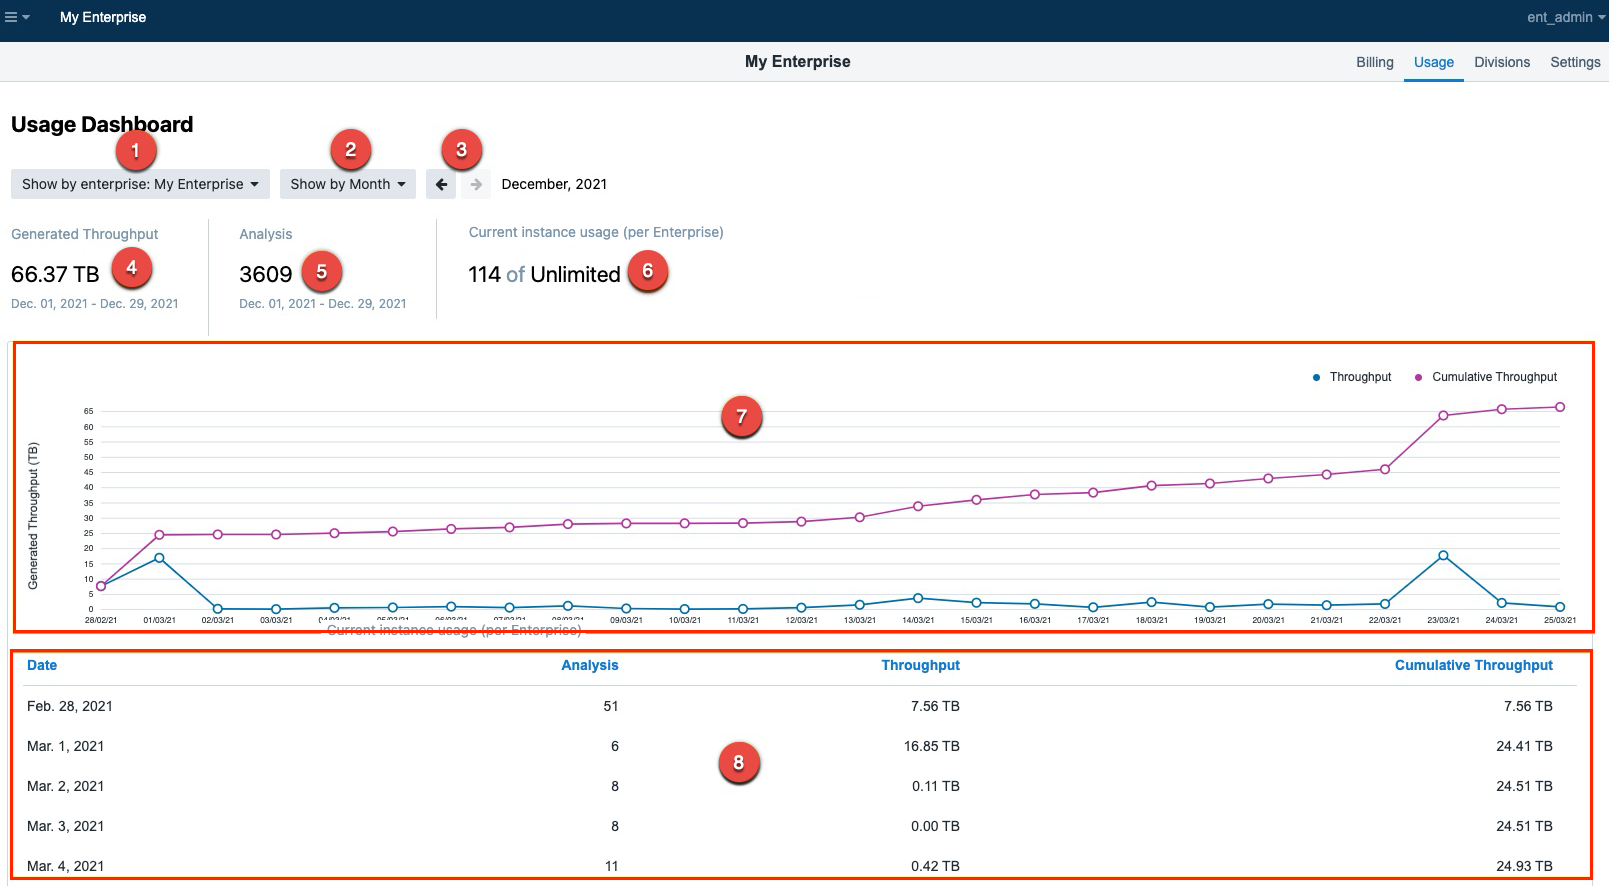
The Usage monitoring dashboard is displayed.

The following information and options are available:
- Choose to show either for the entire enterprise or per division.
- Choose the time interval (week, month or a year).
- Move through the selected time interval (e.g. choose "Show by month" and use the arrows to move back and forth between months).
- Total amount of generated throughput for the selected time interval.
- The total number of performed analyses for the selected time interval.
- Current instance usage (per Enterprise).
- Diagram view of the generated throughput as well as cumulative throughput.
- Tabular view of the generated throughput as as cumulative throughput.
Updated 6 months ago
