Troubleshooting tutorial
Tasks and examples described in this guide are available as a public project on the Seven Bridges Platform.
Often the first step to a user becoming comfortable using the Seven Bridges Platform is their gaining confidence in resolving issues they encounter on their own. This confidence usually comes with experience – the experience with bioinformatics tools and Linux environment in general, but also the experience with the Platform features.
However, one of the reasons for developing the Platform in the first place is to enable an additional level of abstraction between the users and low-level command line work in the terminal. Even though there are a number of Platform features that help with tracking down the issues, the less-experienced users can still face challenges with troubleshooting because the whole process might assume familiarity digging through the tool and system messages.
Fortunately, there is a set of steps that most often brings us to the solution. Based on internal knowledge and experience, our team has come up with the Troubleshooting Cheat Sheet (Figure 1) which should help you navigate through the process of resolving the failed tasks.
.

Figure 1. Troubleshooting Cheat Sheet
Helpful terms to knowTool/App refers to a stand-alone bioinformatics tool or its Common Workflow Language (CWL) wrapper that is created or already available on the Platform.
Workflow/Pipeline (interchangeably used) – denotes a number of tools connected together in order to perform multiple analysis steps in one run.
App stands for a CWL wrapper of a tool or a workflow that is created or already available on the Platform.
Task – represents the execution of a particular tool or workflow on the Platform. Depending on what is being executed (tool or workflow), a single task can consist of only one tool execution (tool case) or multiple executions (one or more per each tool in the workflow).
Job – this refers to the “execution” part from the “Task” definition (see above). It represents a single run of a single tool found within a workflow. If you are coming from a computer science background, you will notice that the definition is quite similar to a common understanding of the term “job” (wikipedia). Except that the “job” is a component of a bigger unit of work called a “task” and not the other way around, as in some other areas may be the case. To further illustrate what job means on the Platform, we can visually inspect jobs after the task has been executed using the View stats & logs panel (button in the upper right corner on the task page):
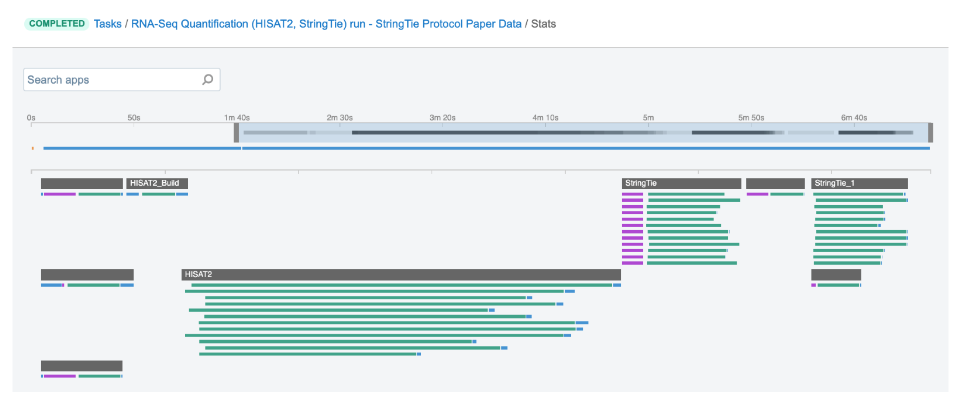
Figure 2. The jobs for an example run of RNA-Seq Quantification (HISAT2, StringTie) public workflow.
The green bars under the gray ones (apps) represent the jobs (Figure 2). As you can see, some apps (e.g. HISAT2_Build) consist of only one job, whereas others (e.g. HISAT2) contain multiple jobs that are executed simultaneously.
Getting started
First, let us learn where to look if something does go wrong: when a task fails, start by checking the error message on the task page. In some cases, this can provide immediate insight, such as indicating a lack of disk space. JavaScript expression evaluation errors are another common issue that can be diagnosed from the task page. These errors are easier to interpret if you are familiar with the script. If not, review the app in editor mode to understand the failed expression and its inputs.
However, in most other cases it won’t be possible to tell the reason for the failure only by looking at the error displayed on the task page. In such cases, we proceed to the View stats & logs panel (see the button in the upper right corner on Figure 3) which gives us all the details related to the run.
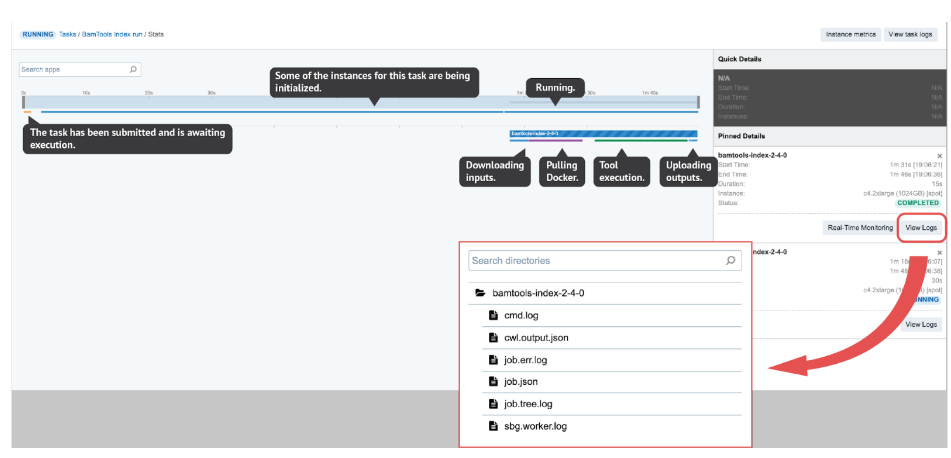
Figure 3. View stats & logs page. Here, we can interactively explore each job and get all the log files for the ones we are interested in. All or some files shown here will be available within logs depending on the task status (e.g. job.tree.log available only after the task is completed or failed). On the other hand, the Real-Time Monitoring button enables users to open up a panel where they can explore the contents of those files while being generated.
There are several interactive features within the View stats & logs panel that you can use to examine your run (Figure 3). However, here we will focus on illustrating the troubleshooting flow with a few examples rather than explaining those features in detail. If you want to learn more about this before getting to the examples, you can do so by checking out the documentation pages – task stats, task logs, job monitoring and instance metrics page.
Also, if you run apps from our Public Apps gallery, we advise reading the app’s description for more info, which can help you through the debugging process.
As already mentioned, there are common steps that usually lead to the problem’s solution and which we tried to condense into the Troubleshooting cheat sheet. Herein, we will apply it to a couple of failed tasks.
EXAMPLES: QUICK & UNAMBIGUOUS
Task 1: Docker image not found
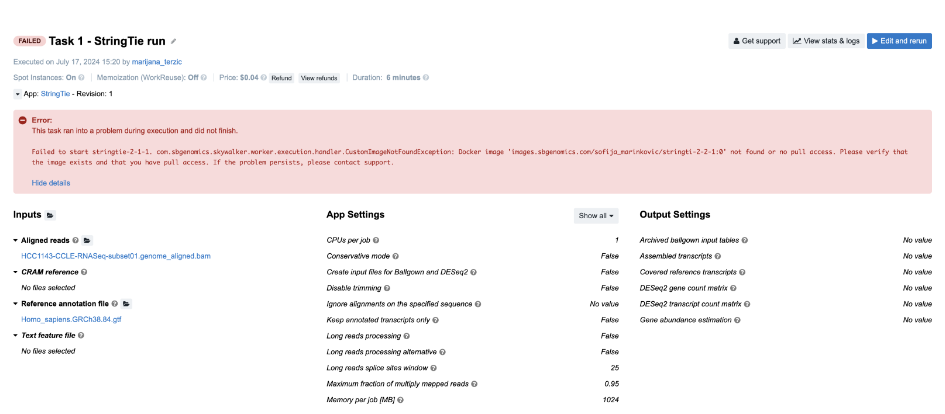
Figure 4. Task 1 - Front page
Diagnosis: As indicated by the error message on the task page, there is a problem related to the Docker image. Upon closer inspection, we can see that there is a typo in the Docker image name – instead of 'images.sbgenomics.com/sofija_marinkovic/stringti-2-2-1:0' we should’ve had 'images.sbgenomics.com/sofija_marinkovic/stringtie-2-2-1:0'.
Task 2: Insufficient disk space
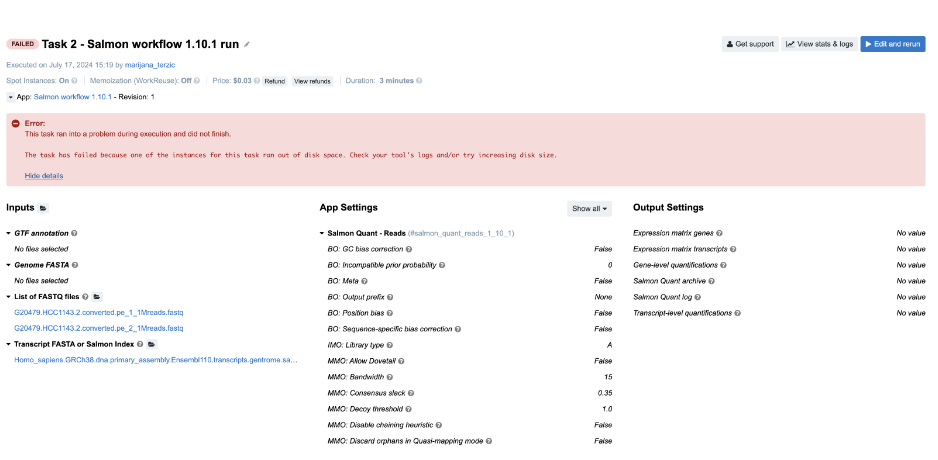
Figure 5. Task 2 - Front page
Diagnosis: Again, it is obvious from the error message on the task page that the task has failed due to lack of disk space.
This can be also confirmed by checking out Instance metrics diagrams from the View stats & logs panel:
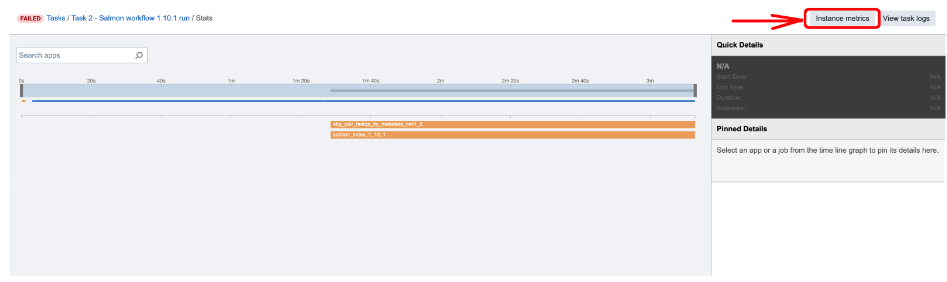
Figure 6. Accessing Instance metrics from View stats & logs panel.
As we see, the line showing the level of the disk space usage (second diagram from left in Figure 7) is at 100%:

Figure 7. Instance metrics diagrams for Task 2.
Task 3: Scatter over a non-list input
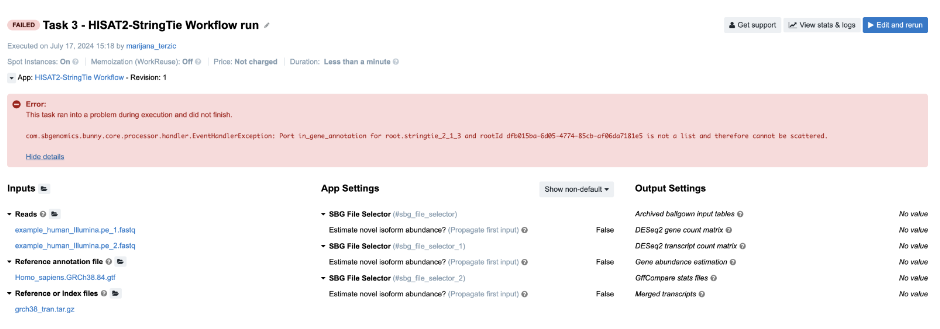
Figure 8. Task 3 - Front page
Diagnosis: The error message on the task page again points to the root of the issue: The Stringtie app was configured to perform scattering over the Reference annotation file input, and therefore expects an array (list) to be provided as an input. Instead of an array, a single file was provided.
Task 4: Automatic allocation of the required instance is not possible
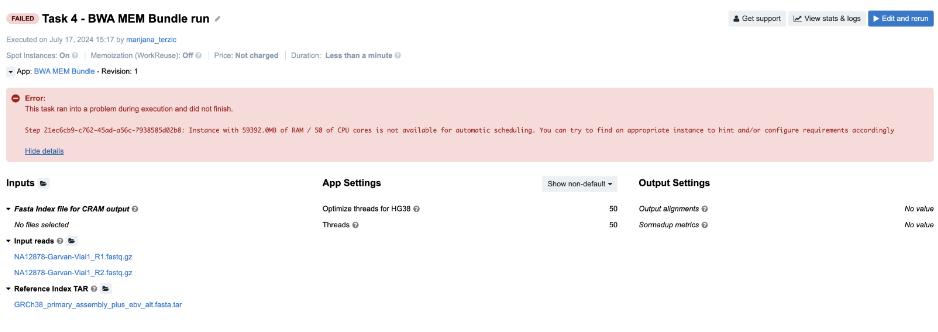
Figure 9. Task 4 - Front page
Diagnosis: In this example, we tried to automatically allocate an instance which will have at least 59,392 MiB of memory and 50 CPUs. To prevent unexpected outcomes due to wrong allocation requirements settings, spinning up the bigger instances is only enabled through the execution hints.
This applies to the cases in which the suitable instance type has 64 GiB of memoryor more. In this example, the instance that fits both requirements (59,392 MiB of memory and 50 CPUs) is m4.16xlarge which has 64 GiB of memory and therefore cannot be allocated unless explicitly set through the execution hints.
Task 5: JavaScript evaluation error due to lack of metadata
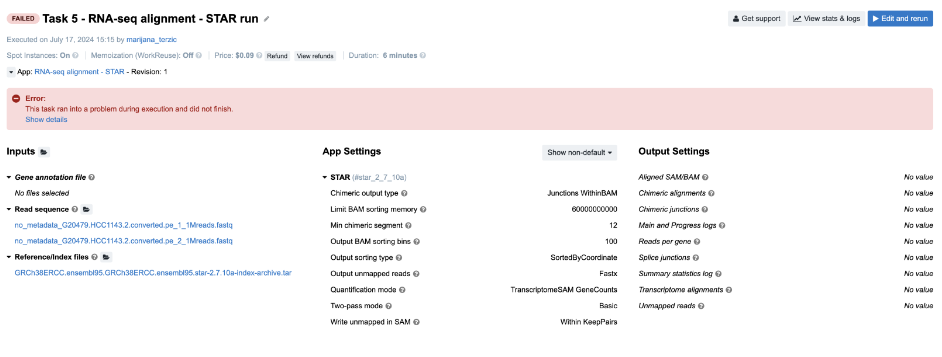
Figure 10. Task 5 - Front page
Diagnosis: If you click on Show details in the error message box, you will get the code of a long JavaScript expression with the evaluation error message in the bottom: TypeError: Cannot read property 'length' of undefined. First of all, don’t let the length of the expression scare you away – this is a pretty simple JavaScript expression. This code prepares a command or configuration string (--outSAMattrRGline) that includes read group information (RG) based on input file metadata.
To identify the root cause, locate where .length is used in the code and determine which expected array or object is not properly initialized or populated. You will likely find that the input files are missing necessary metadata. You can verify this by checking the files under the Read sequence input.
Important note: If you end up debugging a task which failed with JavaScript expression error, you won’t have log files for the corresponding tool, since the tool itself didn’t even start the execution. In case you are running a workflow and want to examine the files that were passed to the tool that failed, you can do so by checking out the outputs from the previous tools. All information about outputs is contained within cwl.output.json file (Figure 3). To go through an example in which this file has been used for debugging, jump to Task 18.
Task 6: Invalid JavaScript indexing
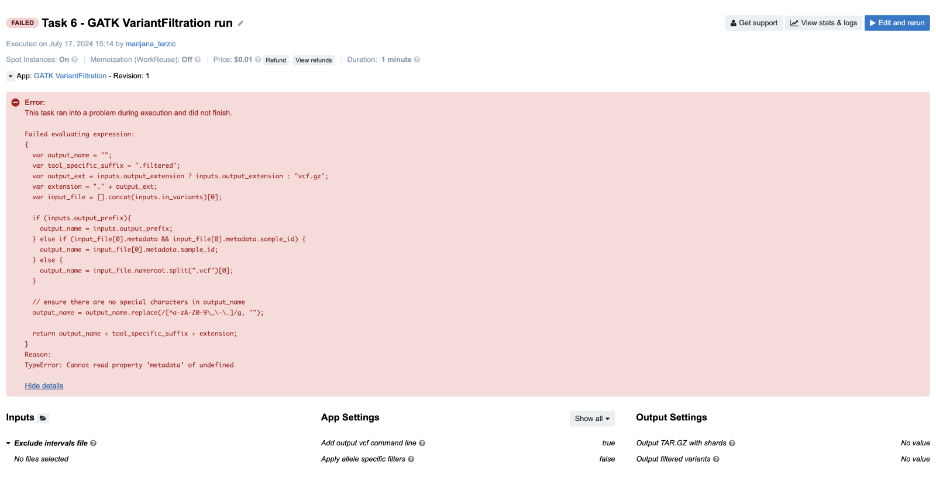
Figure 11. Task 6 - Front page
Similarly to Task 5, you will see a JavaScript expression with the evaluation error message at the bottom: TypeError: Cannot read property 'metadata' of undefined. The solution can be found by checking where .metadata is used in the code. It is always applied to input_file[0], but the problem occurs because we falsely assumed that input_file, actually inputs.in_variants, was a list of files. We tried to get the metadata of the first item of that list in the JavaScript expression, which resulted in a TypeError because a single file is expected for this particular input.
Task 7: Insufficient memory for a Java process
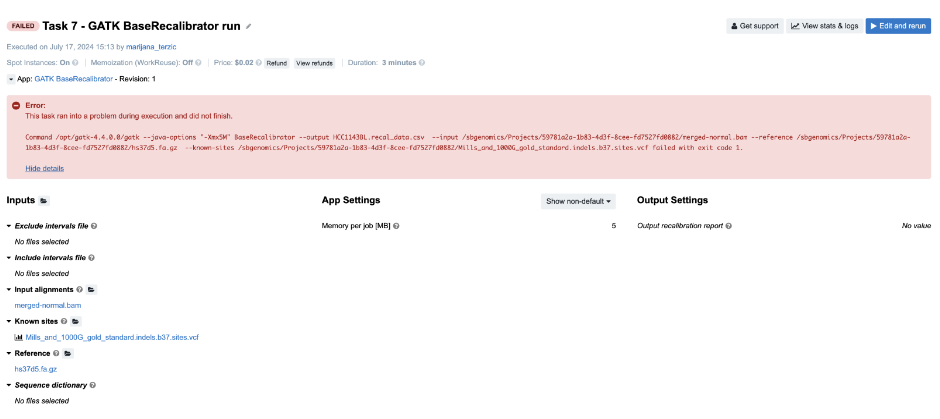
Figure 12. Task 7 - Front page
Diagnosis: As opposed to previous examples, in this one we can’t figure out the issue based solely on the error message on the task page. As you can see, the command which is printed out in the error message failed with exit code 1. In programming, any non-zero exit code indicates that there was an issue in a certain step within the tool, but the meaning of the exit code number can vary in different tools. Because of that, it is time to dig deeper into the task. Following the Troubleshooting Cheat Sheet (Figure 1), we end up examining the job.err.log file under View stats & logs (Figure 3) which starts with the following line:
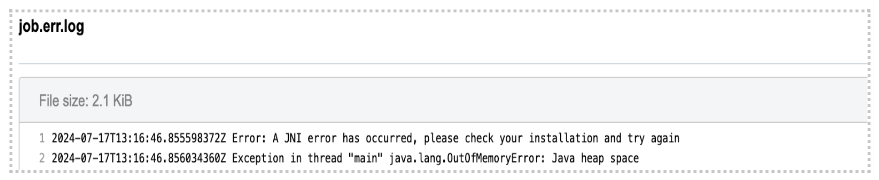
Note that the memory-related exception has been indicated which leads us to the conclusion that we should increase the memory that we pass to Java processes. This means that the value of the parameter Memory Per Job is insufficient. The value of this parameter is used to determine the "-Xmx5M" Java parameter which you can also see by looking into the app’s wrapper from the editor.
EXAMPLES: FILE COMPATIBILITY CHALLENGES
Before jumping to the next few examples, we would like to dedicate a couple of paragraphs to file compatibility issues. Although the issues presented may not be strictly specific to RNA-seq analysis only, many users encountered issues while working with RNA-seq in particular. Therefore, we will focus only on RNA-seq examples here, though it will be worthwhile to go through the following material even if you don’t deal with RNA-seq data in your research.
In contrast to many other tools, RNA-seq tools rely not only on reference genome, but also on gene annotations. Considering that there are a number of different versions and builds of both genome and gene references, pairing these together and getting exactly what you intend may sometimes pose a serious challenge.
Additionally, different tools will treat genome-gene matches differently. Some tools may complete runs successfully even though we provide incompatible pairs on the input, while others may only take chromosome names into consideration regardless of the reference versions. For instance, STAR will execute successfully when the gene annotations and genome are of different builds (GRCh37/hg19 and GRCh38/hg38) but follow the same chromosome naming convention (either “1” or “chr1”).
Since we cannot rely on tools to tell us if we have incompatible input files, the responsibility for matching the reference files correctly falls back to the end-user. Even when the user is aware of the compatibility prerequisite, there are still ways the analysis can go wrong. Hence, we will present here a few examples of RNA-seq-typical failures.
Task 8: STAR reports incompatible chromosome names
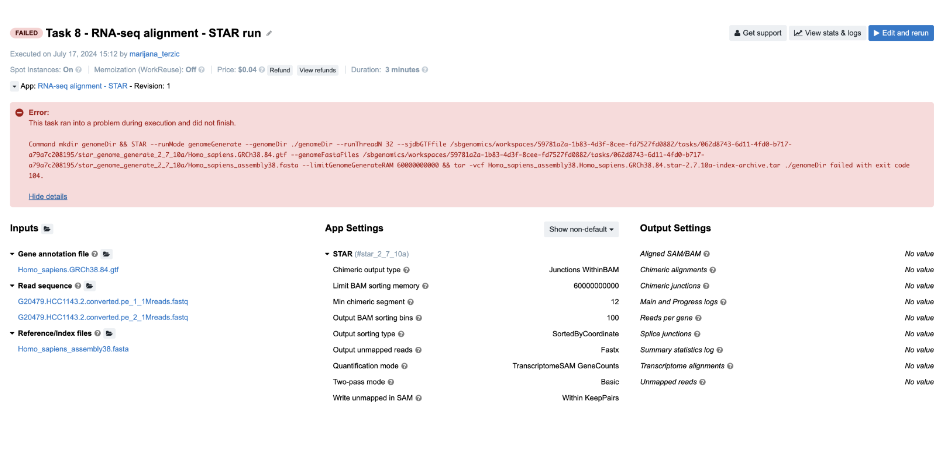
Figure 13. Task 8 - Front page
Diagnosis: If we follow the steps from the Troubleshooting Cheat Sheet, we will end up checking the job.err.log file and getting the following message:
2024-07-17T13:15:08.458254268Z 2024-07-17T13:15:08.458272843Z Fatal INPUT FILE error, no valid exon lines in the GTF file: /sbgenomics/workspaces/59781a2a-1b83-4d3f-8cee-fd7527fd0882/tasks/062d8743-6d11-4fd0-b717-a79a7c208195/star_genome_generate_2_7_10a/Homo_sapiens.GRCh38.84.gtf2024-07-17T13:15:08.458276207Z Solution: check the formatting of the GTF file. One likely cause is the difference in chromosome naming between GTF and FASTA file.2024-07-17T13:15:08.458278335Z 2024-07-17T13:15:08.458280256Z Jul 17 13:15:08 ...... FATAL ERROR, exiting
Indeed, STAR reports that there is a difference in chromosome naming: reference genome contains “chr1”, whereas gene annotation file has only “1” for chromosome 1.
Another path for troubleshooting is reading the Common Issues and Important Notes section in the workflow descriptions. We strongly encourage everyone to go through the app/workflow descriptions before running the tasks.
Task 9: RSEM reports incompatible chromosome names
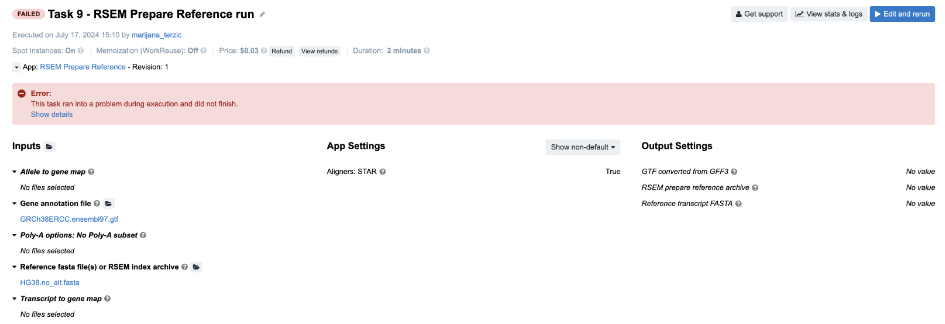
Figure 14. Task 9 - Front page
Diagnosis: Again, we examine the job.err.log file content and get some clues from the last rows:

Here, the message is not so specific as in the case of STAR’s report. However, it looks like we have something to begin with and someone else has experienced the same issue. If we google the message from the last row, this is one of the first answers that we get:
Sounds like a slightly curt answer, but that is because someone finally had enough of people mixing apples and oranges when it comes to matching the genes to genomes.
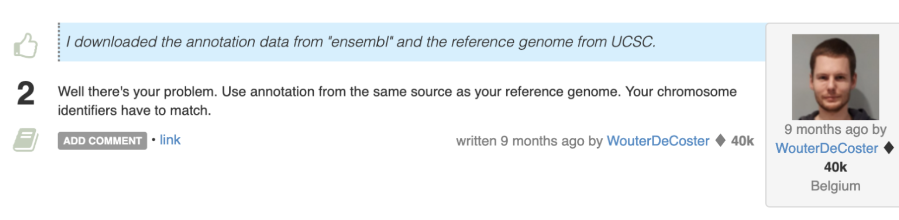
Task 10: Incompatible alignment coordinates
Another very common issue you may encounter is that quantification tools expect alignments on transcriptome coordinates. As a newcomer to bioinformatics, this may not be an obvious consideration, and you might need to revisit the alignment step to address this. The following is an example of an RSEM task configuration that leads to an error:
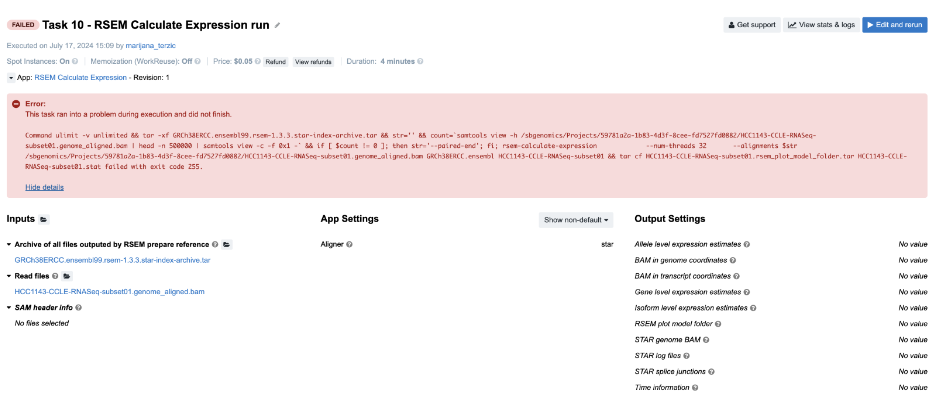
Figure 15. Task 10 - Front page
Diagnosis: As you can see, the BAM provided on the input contains “genome_aligned” in its name which tells us that the coordinates are genome coordinates. If we are not aware of this, we may go check the log files first. Again, the following is the content of the job.err.log file:
`2024-07-17T13:13:28.599625232Z Warning: The SAM/BAM file declares less reference sequences (287) than RSEM knows (228028)! Please make sure that you aligned your reads against transcript sequences instead of genome.
2024-07-17T13:13:28.763200425Z RSEM can not recognize reference sequence name 1!`
And that gives us the needed answer. Note that in case of the STAR aligner, the user does not need to provide transcriptome reference explicitly. Setting the parameter for choosing the alignment coordinates (--quantMode or Quantification mode on the Platform) solves the problem in a simple way.
EXAMPLES: WHEN ERROR MESSAGES ARE NOT ENOUGH
Up to this point, we have been trying to solve the problems only by looking at the error messages on the task page and in the job.err.log file. However, there are a few additional resources that may be informative and help you figure out what went wrong.
Task 11: Invalid command line
Figure 16. Task 11 - Front page
Diagnosis: Following the instructions from the Troubleshooting Cheat Sheet, we will go through the following steps:
- The error message on the task page is not informative, so we proceed to the
job.err.log file. - Content of the
job.err.log file:
2024-07-17T13:10:17.655657688Z [main] unrecognized command '--output-fmt'
The error message is quite specific since it refers to the particular samtools argument. However, we still do not know what happened and we decide it is best if we check out the command line itself. By doing that we can see how exactly --output-fmt got incorporated into the command line.
- Content of the
cmd.logfile:
/opt/samtools-1.9/samtools --output-fmt SAM -o merged-normal.sam /sbgenomics/workspaces/59781a2a-1b83-4d3f-8cee-fd7527fd0882/tasks/3c1f64b0-fde7-420a-b64a-c6cb093c9e15/samtools-view-1-9-cwl1-0/merged-normal.bam
As we can see, the argument --output-fmt is present in the command line, it is included without any typos, and it has a valid value, which is SAM. However, we notice that we lack a samtools subcommand, which is view in this case. Because the --output-fmt argument happens to be placed where the subcommand view is expected, samtools will report it as an unrecognized command since it is neither of the existing subcommands (view, sort, index, etc.).
In general, invalid command lines tend to produce misleading error messages. Something gets omitted, and something else ends up in its place. Usually, that “something else” finds its way into the error message as the reason for failing, even though the omitted part is the true cause of the failure.
Task 12: Invalid input file format

Figure 17. Task 12 - Front page
- Looking at the error message on the task page gives no clues to the failure cause, so we aim for the
job.err.logfile of the app that failed. - Continuing to the View stats & logs page, we find that the sbg_fastq_quality job failed. Additionally, the error message on the task page indicates an issue with SBG FASTQ Quality Adjuster, which prompts us to open the corresponding log files for further investigation.
- Content of the
job.err.log file:
Exception: Quality scale for range (0, 255) not found.
- This brings us to the next step – checking the inputs for this particular app. Luckily, there’s only one – the input named List of FASTQ files to which we have passed a BAM file. And that is the answer – apparently, the app does not work with BAMs, which we can also double check by inspecting the app description.
Task 13: Invalid input file format

Figure 18. Task 13 - Front page
Diagnosis:
- The first error message indicates that the tool has failed, so we have to look elsewhere.
- On the View stats & logs panel, we select the
bwa_mem_bundle_0_7_17_cwl1_0_1_sjob and go to logs. Next, we openjob.err.logfile where we spot the error among other lines:
`tar: This does not look like a tar archive`- This again looks like a problem with the input file. If we check the Reference TAR archive for BWA-MEM input port, we notice a BAM file instead of a tar archive file, which caused the issue.
Task 14: Missing required metadata
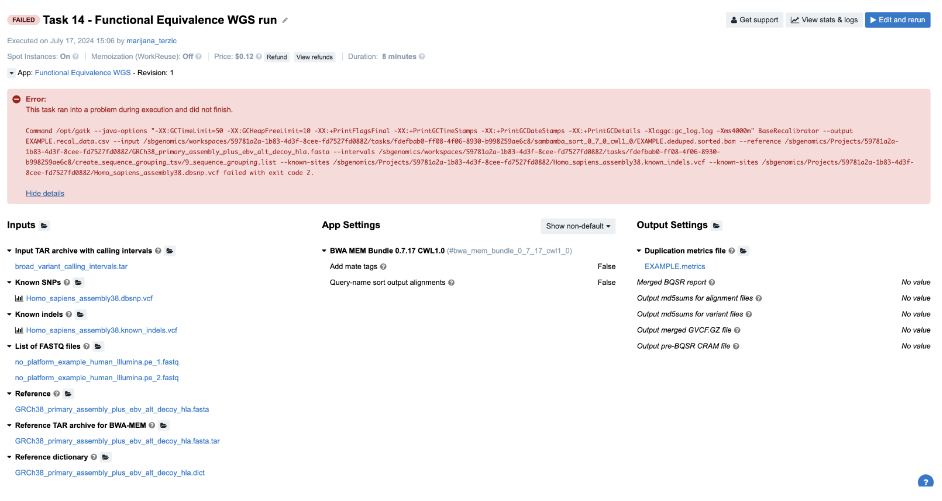
Figure 19. Task 14 - Front page
Diagnosis:
- Obviously, we need to try to find answers by checking out the logs.
- Again, we inspect
job.err.logfile of the GATK_BaseRecalibrator job and detect a user error:
A USER ERROR has occurred: Read SRR316957.2380012 chr9:41008959-41009037 is malformed: The input .bam file contains reads with no platform information. First observed at read with name = SRR316957.2380012 - Now, we have enough reasons to suspect input file format or validity. However, we can quickly eliminate the potential issues with the format since the app accepts FASTQs. So the question is: “What else can I check before digging into the problematic file itself?” SB bioinformaticians tend to try all the cheap checks before examining the content of the inputs. It seems like everything is good with how the command line is built since the tool started analyzing the content of the file, but we can also check the cmd.log file to confirm this. Afterwards, there is nothing else worth checking in the log files, so the last quick resource is the Common Issues and Important Notes section from the workflow descriptions. Fortunately, we find that input reads data in FASTQ format must have appropriate metadata fields populated, such as “platform”, which our provided inputs lack.
Task 15: Incompatible input/output types
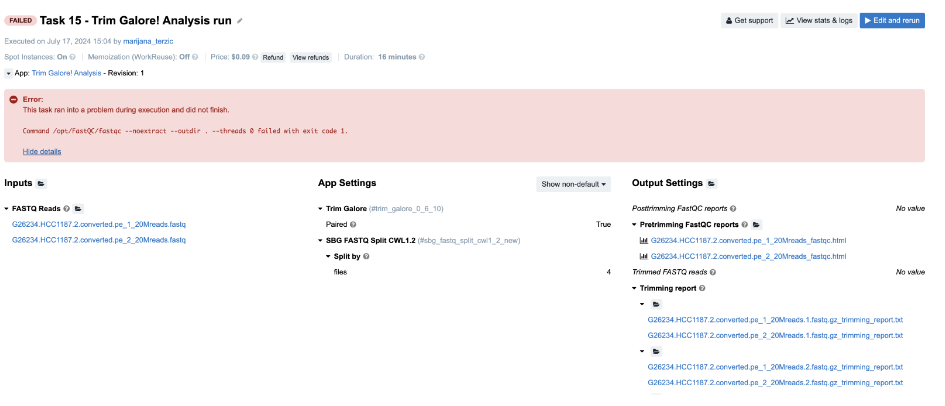
Figure 20. Task 15 - Front page
Diagnosis:
-
No clues on the task page, so we look further.
-
From the View stats & logs panel we observe that fastqc_0_11_10 job has failed and we examine its
job.err.logfile:
2024-07-17T13:20:30.298601490Z Exception in thread "main" java.awt.HeadlessException: 2024- 07-17T13:20:30.298624954Z No X11 DISPLAY variable was set, but this program performed an operation which requires it. -
This message is not very helpful, so our next step is to check the input of this app (FastQC), which is generated in the workflow. The easiest way to do this is by inspecting the job.json file, which contains the complete configurations for this job, including parameters, resources, and inputs. The string that you should search for in this file is "inputs" : {. It’s always the last key in this log file and it contains information about all inputs for the corresponding job. This is how it looks like in this case:
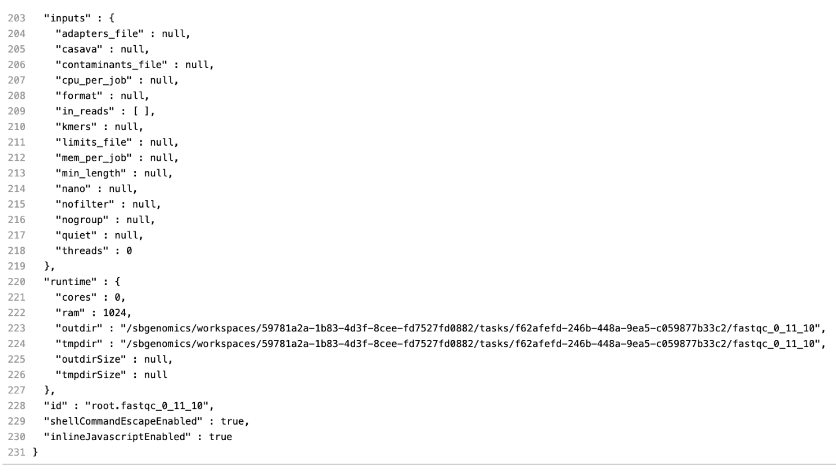
Under the inputs section, we notice the following: "in_reads" : [ ]. The reason this app failed is due to an empty list on its input.
- The next step is to check the app before this one in the workflow and understand why its output is empty. The app in question is SBG FASTQ Merge. Inspecting its inputs in the job.json file, we find that the input of interest, "in_reads", begins with [ [, indicating that this input is a list of lists. Since SBG FASTQ Merge is designed to take only a single list of files as input, we can conclude that this is the reason for the task failure.
But let us elaborate on this a bit more. The tool which precedes this one – Trim Galore – is scattered and it produces a list of two trimmed FASTQ files per each of 4 jobs (green bar below the TrimGalore bar):
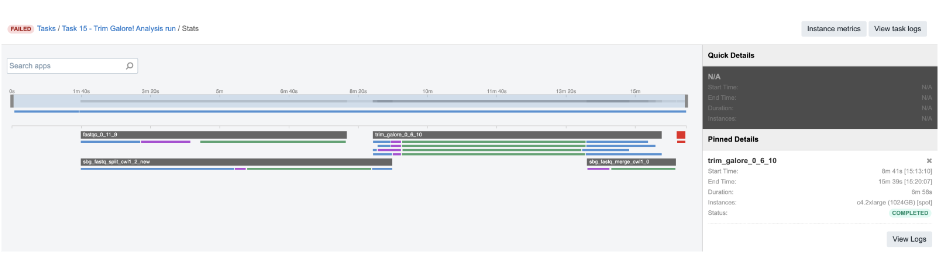
Figure 21. TrimGalore parallel jobs
Therefore, when all the lists of two files are created, they are passed to the next app as a list of lists. In cases like this, SBG Flatten or SBG FlattenLists apps can be added in between to convert any kind of nested lists into a single list.
Task 16: Redirecting STDOUT to a file/Missing secondary files
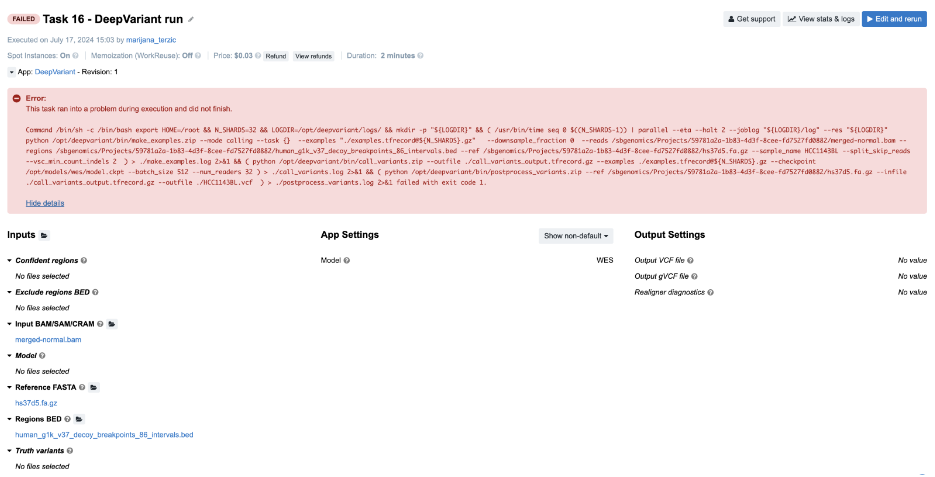
Figure 22. Task 16 - Front page
Diagnosis:
- The tool broke with a non-zero exit code, so we proceed to
job.err.logfile. - The file is empty, but there is an additional log file
make_examples.logwhich contains both STDERR and STDOUT messages (we can confirm this from thecmd.logfile). We can get some hints related to the failure towards the end of the file:
ValueError: NOT_FOUND: could not load fasta and/or fai for fasta /sbgenomics/Projects/59781a2a-1b83-4d3f-8cee-fd7527fd0882/hs37d5.fa.gz - This indicates a problem with the FASTA file and its secondary index file. Public apps and workflows are designed to automatically recognize and fetch index files if they are present in the project. In this case, the FASTA index file is missing.
Important note: For regular uncompressed FASTA files, the index file has a .fai extension. For gzipped FASTA files, both a .fa.gz.fai file and a .fa.gz.gzi file are required. In this case, both files are required as indices and need to be present in the project.
Task 17: Insufficient Memory
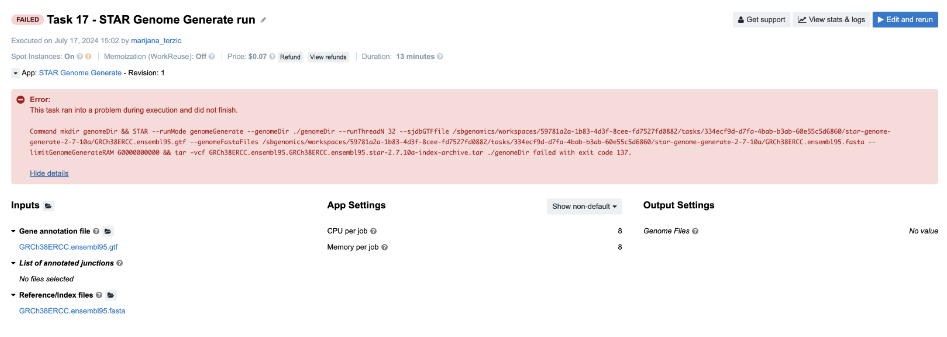
Diagnosis: As usual, we try to get some clues from the job.err.log file, since there is not much information on the task page. Here is what we read there:
2024-07-17T13:15:28.486585083Z Killed
Skimming through the Troubleshooting Cheat Sheet, the message that we see most likely falls under the D box. If we go through all the items listed within this category, we’ll eliminate all but the last one. For those who don’t have much experience with debugging, the exception message Killed is triggered by the kernel and it is always associated with resource exhaustion (e.g. memory/swap). So, the next time you spot such an exception message in the log files, you can start focusing on the memory issue immediately.
If we try to confirm this by looking at the instance metrics (Figure 24), we see that the RAM profile approached its maximum value. Additionally, the swap memory usage diagram, located below the RAM profile, shows that swap memory usage was extremely high. This indicates a significant demand for memory that the system couldn't accommodate, leading to the allocation of additional virtual memory, known as swap.
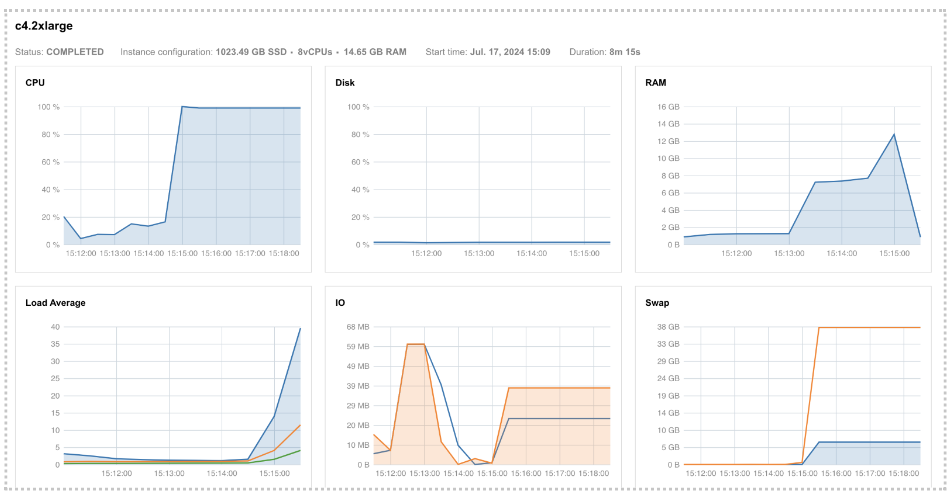
Figure 24. Instance profiles for Task 17 showing high RAM and swap demand.
If you are wondering why we don’t see a maximum peak in the RAM diagram as well, the reason might be that our services don’t record values for every point in time. Instead, usage is measured every 30 seconds, which means that brief glitches can be missed.
Task 18: Invalid output glob
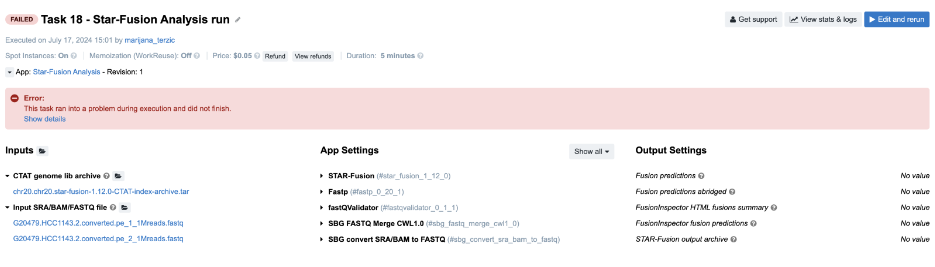
Figure 25. Task 18 - Front page
-
For debugging this task, the key information is the error message on the task page. Clicking Show details reveals a JavaScript evaluation error:
TypeError: Cannot read property 'path' of undefined. This indicates an issue with the input files for a tool in the workflow. The View stats & logs panel shows that the star_fusion job failed without any logs, suggesting we check its input files by reviewing the output of the preceding Fastp tool. -
The
cwl.output.jsonfile from Fastp shows theout_trimmed_readsoutput is empty("out_trimmed_reads" : [ ]). -
After identifying that an empty list was generated by the Fastp app, we should check the inputs to this app. Inspecting the
job.jsonfile for the Fastp tool, we found two FASTQ files listed under the in_reads section. The issue is with the Fastp output files, which are missing despite regular input. -
The next step for further investigation is to check the content of the
job.tree.logfile, which provides a snapshot of the working directory after the job has completed. This is where we can look for the files that are missing from our output: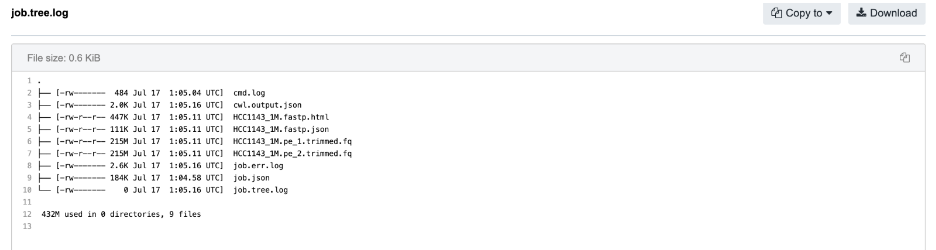
-
The two .fq files that we have expected to see on our output are indeed listed here. This immediately suggests that there might be a problem with the glob expression on this particular output. Finally, examining the glob expression in Fastp via the app editor or
job.jsonfile confirms the issue: an invalid glob value *.fq.gz was used instead of the correct .fq.
CLOSING REMARKS
After reading this guide, you now have the know-how and confidence to resolve many different issues that you may encounter when working on the Seven Bridges Platform. These example tasks represent the most common issues and their corresponding debugging directions that our team has encountered through extensive work with various bioinformatics applications, but is by no means comprehensive: as datasets, tools, and workflows are constantly changing, it would be near-impossible to account for every possible error.
However, this guide is not the only helpful tool at your disposal! Are you just getting started on the BDC, and need help setting up a project? See our comprehensive tips for reliable and efficient analysis set-up. If you need more information on a particular subject, our Knowledge Center has additional information on all the features of the Platform. Really stuck on a tough technical issue, or encounter a stubborn bug in your workflow that just won’t go away? Contact our Support Team, and they will assist as soon as possible!
Updated 9 months ago