Data Browser features
QUERY DATASETS via the Data Browser > Data Browser features

1 Dataset name
The name of the dataset you are querying is on the left side of the top navigation bar. In the image above, you are currently querying the legacy TCGA dataset found under the "Legacy" category.
To clear your canvas and switch to another dataset (e.g. CCLE,), simply click on the visible dataset name (e.g. TCGA). This opens a dialog in which you can select the alternate dataset.
2 Query name
The name of your query is also on the left side of the top navigation bar. This defaults to New query if your query is unsaved.
3 Queries
Click on Queries to reveal different actions relating to queries, as shown below.

Choose to create a new query, open a previously saved query, open an example query provided by the Seven Bridges team, or save a query.
Learn more about:
- Starting from an example query
- Building a query from search terms
- Building a query from scratch
- Working from an existing query
4 Save a query
You can save any query on the Data Browser. Note that empty canvases cannot be saved as queries.
This feature is still in Beta, and we will continue to make improvements.
To save a query:
- Click Queries on the top of the Data Browser canvas next to the help icon.
- Select Save from the drop-down menu.
- In the pop-up window which appears, you can name your query, as shown below. Click Add description to add a brief description of your query.
- Then, click Save Query.
All saved queries can be accessed by selecting Open saved from the Queries drop-down menu. Learn more about accessing saved queries.
Limitations for saving a queryWhen you save a query, you are saving it using the current data model for any given dataset. In case the data model subsequently changes, it is possible that you may not be able to run your query until you rebuild it using the current data model for a dataset.
A Data model determine the nomenclature for all elements that are included in that model. Furthermore, it defines all entities and their properties as well as relationships between different entities.
In order to rebuild your query, learn about the current data model versions for each of the available datasets as well as update history.
5 The Search Box
Click on Search by ID to reveal the search box. The search box allows you to search by UUID, ID (TCGA Barcodes), or file name.

You can enter more than one UUID, ID (TCGA Barcode), or file name (one per line or separated by commas) into the search box and click Next to select a case and continue building a query using the canvas (learn more).
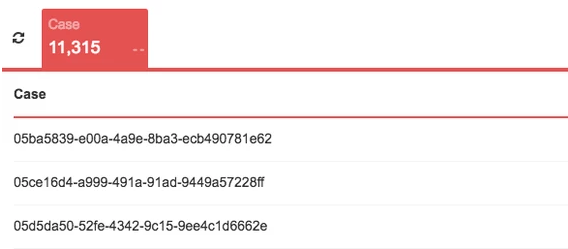
6 Count
The Count feature quantifies the scope of the data returned by your query.

The number of entities returned change as you add filters to your query. The count cards at the bottom of the page gray out to let you know the represented quantities need to be refreshed.
To refresh the number of instances of each entity returned by your query, click the circular arrows next to the count cards.
7 Clear All
The trash can icon on the canvas acts a the "clear all" button. It allows you to delete all previous queries and opens a new query canvas.
8 Copy files to project
The +Copy files to project button allows you to copy files that satisfy your query to your desired project. Alternatively, copy files from any File node. Learn more about accessing data for use in your project.
9 Table of results: List view
The table below the Data Browser contains further details about your query. The List view displays a list of UUIDs for the entities which match your query. This allows you to review returned results, but it does not allow you to select or filter results. All selection and filtering have to be done via the query on the Data Browser canvas.
10 Table of results: Details view
The table below the Data Browser contains further details about your query. The Details view displays details of the selected entity in the context of your query, as shown below for the Sample 1 entity.
The lefthand column, Connections, displays the inbound and outbound connections for the selected entity in the context of your query.
The middle column displays a list of UUIDs corresponding to the selected entity that match your query. Click on any one UUID in the middle column to view its metadata corresponding in the rightmost column.

11 Table of results: Analytics view
The table below the Data Browser contains further details about your query. The Analytics view displays the distributions of the members of each entity, as shown below.
These graphs are an alternative way to visualize query results and reflect the same information as is displayed in the table. Note that currently only pre-defined, selectable values of a property can be visualized.

12 Export query results
Export query results as a CSV, JSON, or XML file from this table by clicking Export.

Updated 3 months ago
